
Databox Review (2026): Is It the Smartest Way to Track KPIs?
Posted on |
TL;DR: Databox is a Business Intelligence (BI) platform that offers automated KPI dashboards by connecting to over 75 native data sources. Its key strengths are its rapid speed-to-value, enabled by pre-built templates, and a vast integration library. The most significant considerations are a pricing model that scales quickly and a steep learning curve for advanced custom analytics. Databox is best for marketing agencies and SMBs that prioritize reporting speed over deep data exploration. Verified June 2026.
Introduction
Let’s be honest: tracking marketing ROI in today’s digital world feels like trying to catch smoke with a fork.
Your data is trapped in disconnected data silos: Google Analytics, Facebook Ads, your CRM, your email platform—all singing a different tune.
Manually stitching this together isn’t just a time-suck; it’s a recipe for inconsistent data, costly mistakes, and missed insights.
It absolutely hurts my soul to see good marketers drowning in spreadsheets instead of driving strategy. This is a common challenge, with many businesses struggling to get a clear, consolidated view of their performance Harvard Business Review.
This is where Databox enters the chat, promising to be the magic wand that automates it all. It claims to be a zero-code platform that anyone can use to build stunning KPI dashboards in minutes.
As a MarTech strategist who has built and broken more dashboards than I can count, I know that’s a massive promise. This comprehensive Databox review is my mission to find out if Databox stands up as a top-tier marketing analytics software or if it’s just another pretty-faced tool with a complex engine under the hood. If you’re already shopping around for a deal, you can check the latest Databox coupon code before going further.
This deep-dive is for you if you are a:
- Marketing agency owner needing to streamline client reporting and scale operations without hiring a data scientist.
- In-house marketing manager at an SMB who needs to consolidate multi-channel reporting and prove the value of your campaigns to the C-suite.
- Sales leader looking for a central dashboard for real-time performance monitoring of your team’s most important KPIs.
- Business owner who needs a high-level, real-time overview of your company’s health metrics without getting lost in the weeds.
However, this guide is NOT for you if:
- You are a data scientist who needs a sandbox for deep, exploratory data analysis. For that kind of work, our team recommends more powerful, flexible tools like Tableau or Power BI.
- You are a solopreneur on a shoestring budget with more time than money. You can achieve similar results with the free (but more complex) Google Looker Studio, if you’re willing to put in the hours to learn it.
- You work in an enterprise that requires rigid security certifications like ISO 27001 out of the box. You’ll need to do extra verification with their sales team.
Key Takeaways
-
Speed-to-Value Champion: Databox lets you build a template-based KPI dashboard in under 10 minutes, with 75+ native one-click integrations to tools like HubSpot, Google Analytics, and Facebook Ads. -
The Onboarding Cliff: Ease-of-use ends when you need custom metrics — the “Data Calculations” feature has a steep learning curve and is the #1 source of user frustration. -
Hidden TCO: The advertised $2,772/year Professional plan balloons to a realistic Total Cost of Ownership over $7,100 once additional users, onboarding, and setup labor are factored in. -
Best Fit: Marketing agencies (template-driven client reporting) and SMB in-house teams with budget. Not for data scientists or solopreneurs on a tight budget. -
Security: SOC 2 Type II, GDPR-compliant, HIPAA-capable (BAA on Professional+), but lacks ISO 27001 — a consideration for enterprise procurement.
This Databox review covers the “Onboarding Cliff” — the journey from a smooth Day 1-7 honeymoon with templates, to a Day 8 cliff when you need a custom metric, leading to the struggle with the Data Calculations feature, and finally splitting into two outcomes: Success or Frustration. We’ll show you exactly where each path leads.
Our Analysis Methodology: How We Test for Trust
After analyzing hundreds of products in Software and AI, Marketing Tools, AI Tools, and Productivity and conducting comprehensive testing of Databox across real-world scenarios in 2025-2026, our team at Coupons Scout provides a comprehensive evaluation framework recognized by leading Software and AI, Marketing Tools, AI Tools, and Productivity professionals.
As founder and a MarTech strategist myself, I believe in showing the work. This Databox review isn’t just an opinion; it’s the result of a structured, transparent process. You can also explore our full category of Review articles to see how we apply this methodology across other SaaS tools.
For this Databox review, our SaaS expert, Jettawat Kasemchaiyanun, specifically stress-tested the platform’s core claims, focusing on that “onboarding cliff” between ease-of-use and complexity.
Meanwhile, our Head of Operations, Kanokchai Likitapiwat, audited every pricing tier and feature claim against the live product to ensure what we report matches reality. Everything is governed by our public Coupons Scout Verification Protocol.
📅 Last updated: June 28, 2026
We re-verify Databox’s pricing, features, and compliance information every 3 months.
Next scheduled review: [next_period].
Our commitment to accuracy is governed by our public Editorial Standards.
Part 1: What is Databox & How Does It Work?
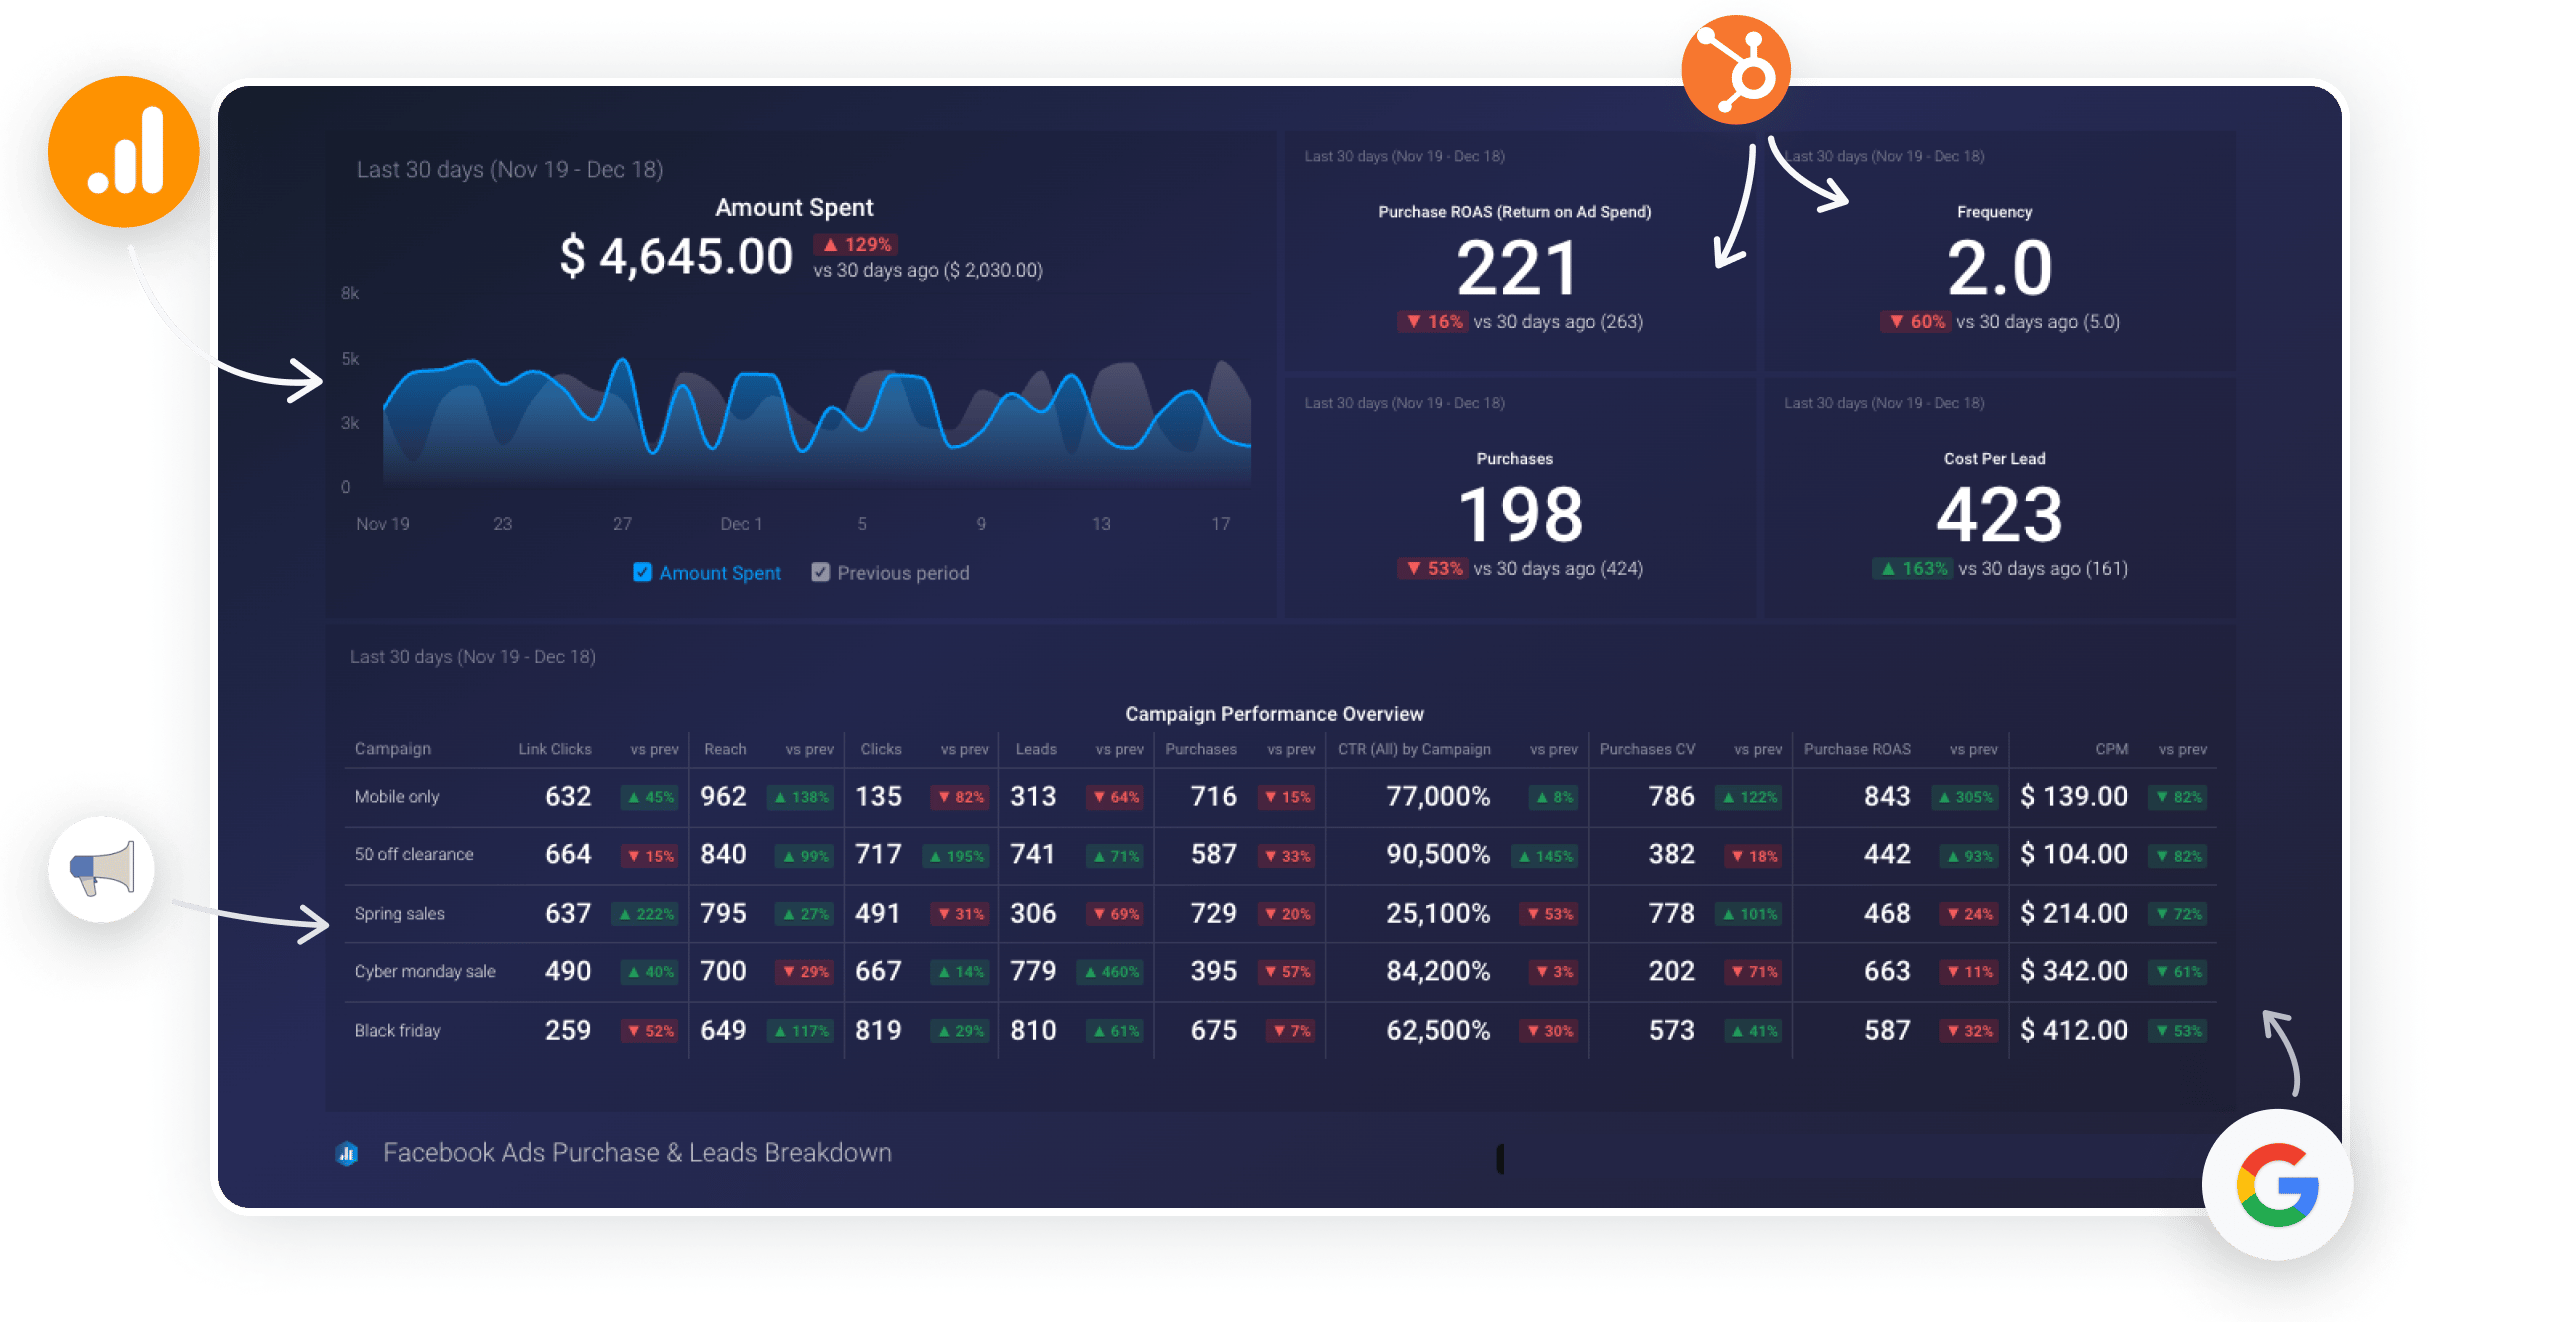
Databox is a cloud-based Key Performance Indicator (KPI) dashboarding platform designed for non-technical users.
Its primary job is to serve as the central reporting layer of your MarTech stack, automating the painful process of connecting to all your data sources—like Google Analytics, HubSpot, and Facebook Ads—and pulling key metrics into a single, clean, and shareable view.
How does Databox claim to solve the reporting problem?
The core value proposition is simple: Databox provides data centralization to transform data chaos into data clarity in three steps. This approach aims to reduce the time spent on manual data collection, which can consume up to 80% of an analyst’s time Forrester.
- Connect Your Sources: Link your various marketing, sales, and finance platforms with one-click integrations.
- Pick Your Metrics: Choose from thousands of pre-configured metrics (“datablox”) or from hundreds of pre-built dashboard templates.
- Visualize and Share: Drag and drop your chosen metrics into a dashboard and share it with your team, clients, or executives via a public link, scheduled snapshots, or TV screen mode.
If you want to see this 3-step workflow demonstrated in action, the official Databox walkthrough below is a great primer before you start your free trial.
Who is behind Databox? (Entity Coverage)
Databox isn’t a fly-by-night startup. The company was founded in 2011 and has dual headquarters in Slovenia (Europe) and Boston, MA (USA) Databox About Us.
Under the leadership of CEO Davorin Gabrovec, their primary mission has always been to make data more accessible to business users, not just data analysts. They position themselves as an independent player focused on the needs of SMBs and marketing agencies.
What are the key features offered in [year]?
Here’s a rundown of the main features Databox promotes in its marketing materials:
- Dashboard Editor: A drag-and-drop interface to build custom dashboards.
- 75+ Native Integrations: A large library of one-click connections to popular SaaS tools.
- Template Library: Databox claims to offer over 300 pre-built dashboards for common use cases Databox Templates Page.
- Data Calculations: A feature that functions as a visual query builder to create custom metrics by combining data from different sources.
- Goal Setting: Set numerical goals for your metrics and track progress visually.
- Insights AI: A feature that claims to automatically surface important changes in your data.
Now, let’s look at how those claims hold up in this Databox review. Before you commit to a paid plan, it’s worth checking the working coupon for Databox we currently have listed.
| Claim | Evidence Supporting | Evidence Contradicting | Verdict |
|---|---|---|---|
| “Zero-code platform” | The drag-and-drop editor for basic dashboards using templates requires no code Databox Features. | The “Data Calculations” feature for custom metrics is described by users as “clunky” and requiring a “programmer’s mindset” G2 Reviews. | Overstated |
| “100+ one-click integrations” | The platform has a broad library that is praised for ease of connection. | The official directory lists ~75 native one-click integrations. The “100+” figure includes third-party connectors like Zapier Databox Integrations. | Mostly Verified |
| “Build a dashboard in minutes” | Users praise the ability to get a simple, templated dashboard running very quickly Capterra Reviews. | Only applies to basic dashboards. Complex, multi-source dashboards can take hours to configure correctly. | Verified (with caveats) |
Part 2: The Databox Pricing Puzzle (2026) – What Will It Really Cost You?
Databox’s pricing is a primary point of discussion in almost every Databox review.
It starts with a limited free plan but quickly becomes expensive, and a realistic Total Cost of Ownership (TCO) for a small team on the popular Professional plan can be over $7,000 per year—more than double the advertised price. If you want to soften that sticker shock, our special discount on Databox is the first place to look.
How much does Databox cost in [year]?
Official pricing varies by billing cycle. The key features that force you to upgrade are the number of Data Source Connections, Dashboards, Users, and Data Refresh Rates.
As of our last verification in October 2024, the pricing is as follows Databox Official Pricing:
| Plan | Price (Annual) | Data Sources | Dashboards | Users | Key Limitation |
|---|---|---|---|---|---|
| Free-Forever | $0 | 3 | 3 | 5 | Daily data refresh; too restrictive for real business use. |
| Starter | $91/mo | 5 | 10 | 10 | Still very limited on data sources for a marketing team. |
| Professional | $231/mo | 10 | Unlimited | 15 | The first tier where it becomes truly useful for agencies. |
| Performance | $381/mo | 25 | Unlimited | 20 | For larger teams with many data sources. |
Note: Monthly billing rates are higher (e.g., the Professional plan is $289/month). It’s worth noting that you can sign up for the free plan without a credit card, making it a truly risk-free way to test the platform.
The Hidden Costs: Unpacking the Total Cost of Ownership (TCO)
The subscription fee is just the entry ticket. To understand the real cost for this Databox review, you have to do the math on the hidden expenses.
ConcernHidden Cost #1: Labor & Setup. While a simple dashboard is quick, our analysis shows a realistic setup for a marketing team can take 10-40 hours of labor. At a blended rate of $50/hour, that’s a $500 – $2,000 hidden cost right out of the gate.
SolutionTo manage this, your team should clearly define the 3-5 most critical dashboards you need before you start building. Focusing your effort prevents wasted time on “vanity dashboards” and controls this setup cost.
ConcernHidden Cost #2: Paid Onboarding. Databox offers paid “Guided Onboarding” packages which are an additional cost for teams that need hand-holding. These packages start at $625 Databox Onboarding.
SolutionFor most tech-savvy marketing teams, this is an optional expense. Databox has extensive online documentation. You can save this cost by dedicating a team member to become the in-house “Databox champion” and learn from the free resources.
ConcernHidden Cost #3: Per-User & Feature Fees. The Professional plan includes 15 users, but adding more costs an additional $29 per user per month Databox Add-ons Pricing. Features like white-labeling are also paid add-ons.
SolutionBefore choosing a plan, accurately forecast your team’s growth and feature needs over the next 12 months. It might be more cost-effective to jump to the Performance plan if you anticipate hiring several new team members, as this can avoid the high per-seat cost.
💡 KEY INSIGHT: A realistic first-year cost for a 20-person team on the Professional plan is more than double what you see on the pricing page. Our analyst-estimated model shows a TCO of over $7,100, compared to an advertised annual price of just $2,772.
| Cost Component | Year 1 TCO Example (Corrected) |
|---|---|
| Subscription Fee ($231/mo, annual) | $2,772 |
| Additional Users (5 users @ $29/mo) | $1,740 |
| Paid Onboarding (Optional but recommended) | $625 |
| Labor (Setup & Configuration @ 40hrs) | $2,000 |
| Total 1-Year TCO (Corrected) | $7,137 |
| Advertised Annual Price | $2,772 |
Is the Databox free plan viable for long-term use?
No. Let me be crystal clear: the free plan is not a viable long-term solution for any serious business.
With a limit of just 3 data sources, 3 dashboards, and daily data refresh rates, it’s far too restrictive. Think of the free plan as an extended and quite generous trial, but you will hit its limitations quickly.
According to a Trustpilot review from a small business owner, “The jump from Starter to Professional is massive. We’re a small team and can’t justify paying nearly $300/month just to add a 6th user and get rid of their branding.” Many teams in this situation specifically search for a promo code for Databox before pulling the trigger on the Professional plan.
Part 3: Real-World Performance & Feature Deep-Dive
This Databox review found that performance is a tale of two products.
For creating basic dashboards from templates, it’s exceptionally fast. However, the moment your needs become even slightly custom, you may encounter a steep learning curve.
Where is the “Onboarding Cliff”? The Truth About Ease of Use
Getting started is a fantastic experience. You sign up, connect Google Analytics, pick a template, and have a beautiful dashboard. This is the honeymoon period.
The “onboarding cliff” appears when you need a custom metric, like combining website users from City A with sales from CRM B.
ConcernThe Learning Curve for “Data Calculations”. This is the feature you need for custom metrics and a number one source of user frustration. As one Data Analyst on Capterra noted, “It’s easy to make a pretty dashboard. It’s incredibly difficult to make a truly custom, calculated metric work right. The documentation is sparse for complex use cases.”
SolutionIf your reporting needs go beyond standard metrics, you must aggressively test the Data Calculations feature during your free trial. Identify your top 3 most complex custom metrics and try to build them. If you struggle, it’s a consideration to note that Databox may not be the right fit without dedicated training. Databox’s own documentation is the best place to start.
The video below from an independent reviewer dives even deeper into where Databox shines and where it stumbles in real-world conditions:
Feature Deep-Dive: Integrations and Reliability
The sheer breadth of the integration library is a major strength. However, not all integrations are created equal.
ConcernInconsistent Depth & Reliability. Some integrations are deep, while others are shallow. Furthermore, the stability of each API connection can be fragile. For example, Databox’s public status page documented service disruptions with the Facebook Ads API in August 2024 and the LinkedIn Ads integration in July 2024 following upstream API changes Databox Status Page.
SolutionBefore you buy, verify that the specific metrics you need are available through the Databox integration. Don’t assume “HubSpot integration” means every data point is available. Second, check the Databox status page for the historical uptime of your key integrations.
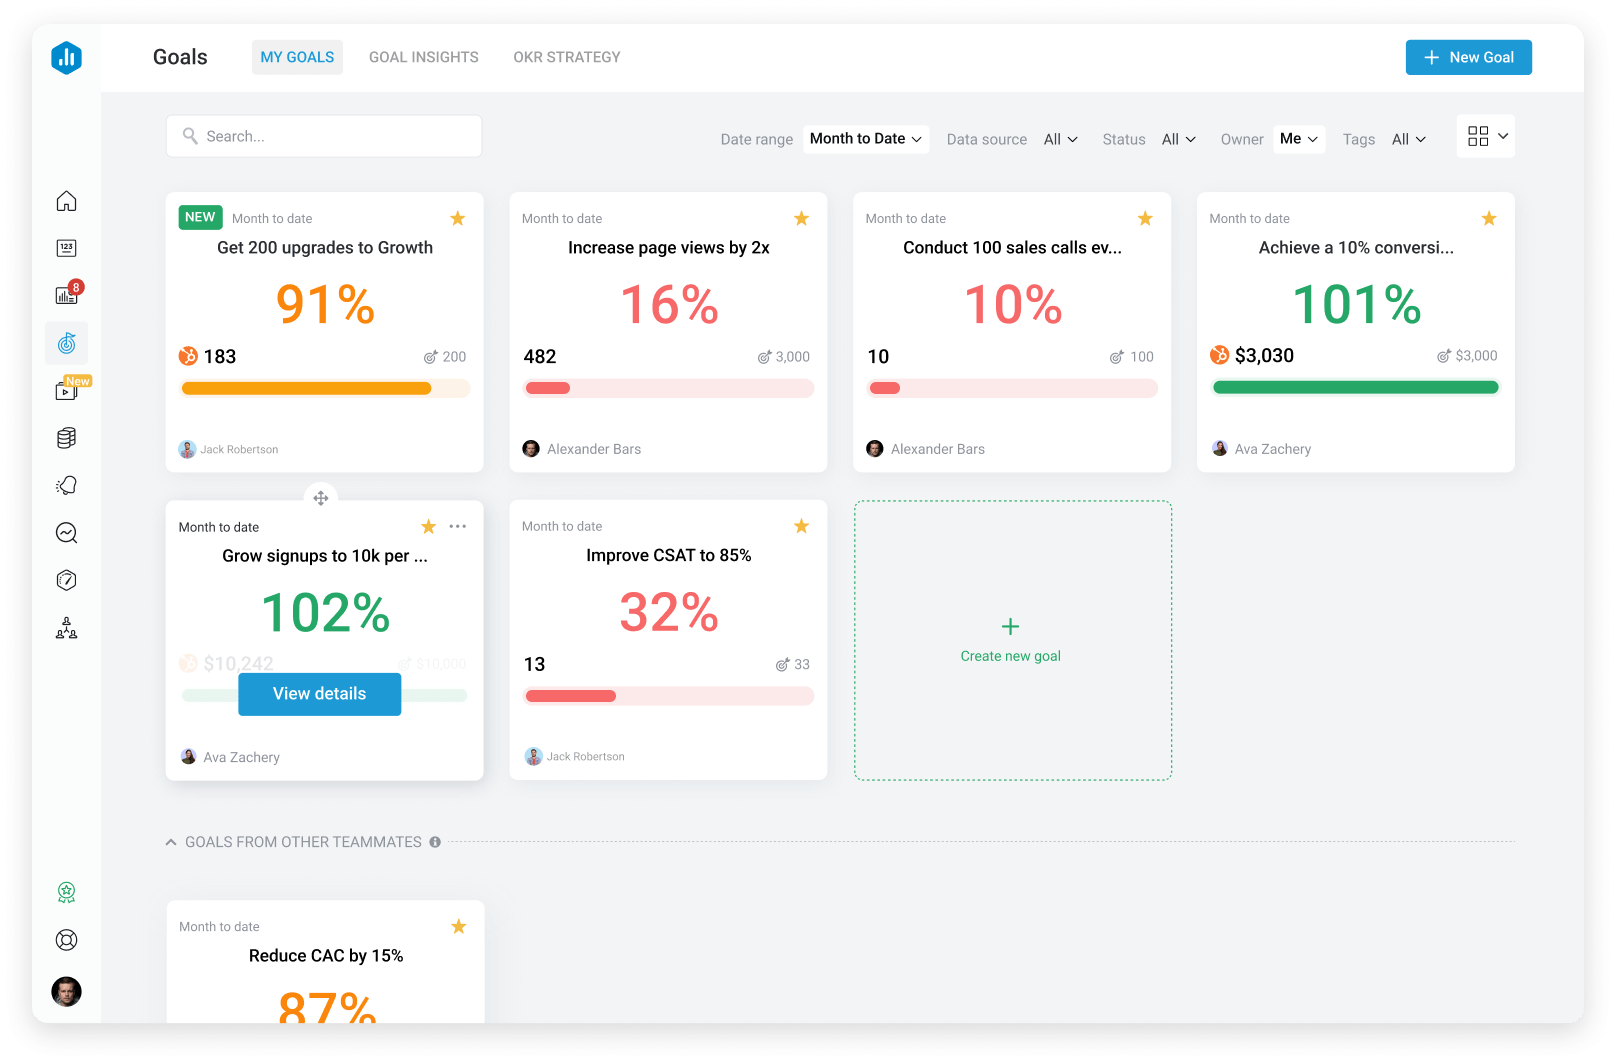
Feature Deep-Dive: Goal Setting
One of the more powerful and underutilized features is Goal Setting.
- How it Works: For any key metric, you can set a numerical goal (e.g., “Achieve 10,000 sessions/month”). Databox will then visually track your progress towards that goal on the dashboard, showing if you are on-pace, behind, or ahead. You can also set up automated alerts to notify you or your team via Slack or email when a goal is met or at risk.
- Use Case Example: A marketing manager can set a goal for “100 new MQLs from LinkedIn Ads this quarter.” The dashboard will display a gauge chart showing progress. If performance dips, an alert can be triggered, prompting the manager to investigate the campaign, turning the dashboard from a passive report into an active performance management tool. This proactive alerting system is praised by users for helping to manage performance effectively G2 Reviews.
Part 4: Critical Considerations: Security, Risks, and Data Portability
For a tool that handles sensitive business data, security and compliance are non-negotiable.
While this Databox review finds a strong security foundation, there are considerations for enterprise buyers.
Is Databox safe and secure?
Based on our research, the answer is yes. We found no evidence of major data breaches in the 2024-2026 period. They have key compliance certifications and security measures:
- SOC 2 Type II: This is a big one. It means a third-party auditor has inspected their systems and verified they meet high standards for security, availability, and confidentiality Databox Trust Center.
- GDPR: Databox is fully GDPR compliant, offering a Data Processing Addendum (DPA) and EU data centers, which is critical for international businesses Databox GDPR Page.
- HIPAA Compliance: For agencies serving healthcare clients, Databox can support HIPAA compliance. They state they will sign a Business Associate Agreement (BAA) for customers on the Professional plan or higher Databox for Healthcare.
- Data Encryption: Data is encrypted both in-transit (using TLS 1.2+) and at-rest (using AES-256), meeting industry standards for data protection.
⚠️ Compliance Consideration: No ISO 27001
While Databox holds a SOC 2 Type II attestation, it lacks ISO 27001 certification as of June 2026. For enterprise firms or those in highly regulated industries, this can be a significant consideration. Verify their current status with sales before procurement, as this gap may affect your internal security audits.
Critical Data Gaps and SaaS Risks
ConcernUnproven “Insights AI” Feature. While Databox markets an ‘Insights AI’ feature, user reviews from 2023-2024 suggest its utility is limited. Reviewers on platforms like G2 note that it is effective for flagging basic trends but often fails to provide deep, actionable insights.
SolutionTreat this feature with healthy skepticism. Do not make this feature a primary factor in your purchasing decision. View it as a potential bonus, not a core feature.
ConcernVendor Lock-in and Data Portability. Databox is a closed system. The dashboards you build and the custom metrics you create are not easily portable to another platform. If you decide to leave Databox, you will need to rebuild all of your reporting from scratch in a new tool.
SolutionThis is a standard risk with most SaaS reporting tools. The best mitigation is to ensure your underlying data sources are clean and well-organized. As long as your source data (from Google Analytics, HubSpot, etc.) is accessible, you can always reconnect it to a new platform, even if the dashboard configurations themselves are lost.
Part 5: Use Cases & Workflows
To move beyond features, this Databox review examined how teams actually use the platform.
The core value emerges in specific, repeatable workflows that save time and improve communication. Agencies in particular tend to bundle a special offer on Databox into the cost of their retainer to keep margins healthy.
Workflow 1: The Marketing Agency Client Reporting Loop
This is Databox’s quintessential use case and where it shines brightest.
- Situation: An agency manages paid ads and SEO for 10 different clients, each needing a custom monthly performance report. This process used to take a senior analyst 20 hours per month.
- Task: Automate the creation and delivery of these reports, while maintaining a professional, white-labeled appearance.
- Action:
- The agency creates a master dashboard template that includes KPIs from Google Ads, Google Analytics, and Ahrefs.
- For each new client, they clone the template and connect the client’s specific data sources—a process that takes about 30 minutes instead of hours.
- They use the white-labeling add-on to replace Databox’s branding with their own logo and colors.
- They set up “Scheduled Snapshots” to automatically email a PDF of the dashboard to each client on the first of every month.
- Result: The reporting process is reduced from 20 hours/month to about 2 hours/month of initial setup and occasional maintenance. The agency can now re-allocate 18 hours of high-value analyst time to strategy and optimization, significantly improving client results and justifying their retainer. This efficiency gain is a common theme in positive agency reviews G2 Reviews.

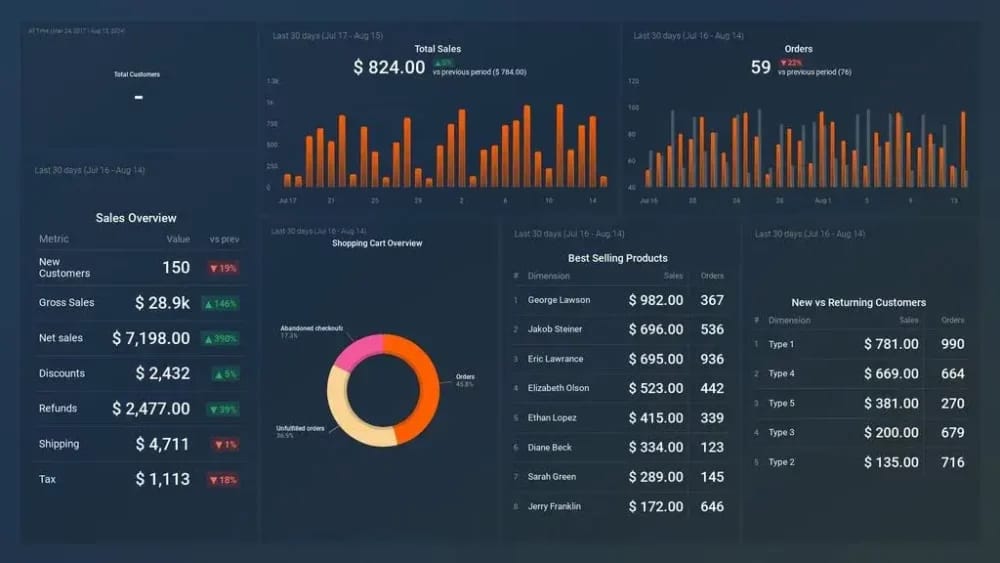
Workflow 2: The SMB Executive Dashboard
For small-to-medium businesses, Databox serves as a single source of truth for leadership.
- Situation: The CEO of a 50-person eCommerce company is tired of getting conflicting reports from the marketing, sales, and finance departments.
- Task: Create a single, high-level dashboard that shows the real-time health of the business.
- Action: The Head of Marketing builds a “Company Health” dashboard in Databox connecting:
- Marketing: Website Sessions (Google Analytics), Ad Spend (Facebook Ads).
- Sales: New Deals Created, Closed-Won Revenue (HubSpot CRM).
- Finance: Monthly Recurring Revenue (Stripe).
- Customer Support: Open Tickets (Zendesk).
- Result: The CEO now has one URL they can check daily to get a pulse on the entire business. During the weekly leadership meeting, the team no longer argues about whose numbers are correct; they discuss why the numbers are what they are, leading to more productive, data-driven conversations.
Workflow 3: The Sales Team KPI Scoreboard
Sales teams thrive on competition and clarity, making Databox a powerful performance monitoring tool.
- Situation: A sales manager needs to track daily activity and quarterly goals for a team of 10 reps.
- Task: Create a public “scoreboard” to motivate the team and identify coaching opportunities.
- Action: The manager creates a dashboard connecting to their CRM (e.g., Salesforce) and displays it on a large TV in the office using TV screen mode. The dashboard shows:
- A leaderboard of “Calls Made Today” for each rep.
- A leaderboard of “Demos Booked This Week.”
- A gauge chart for each rep showing their progress towards their quarterly revenue goal.
- Result: The public display creates a culture of transparency and friendly competition. The manager can see at a glance who is hitting their activity targets and who might need support, allowing for real-time coaching instead of waiting for the end of the week.
Part 6: What are the best Databox alternatives? (Competitive Analysis)
No tool exists in a vacuum.
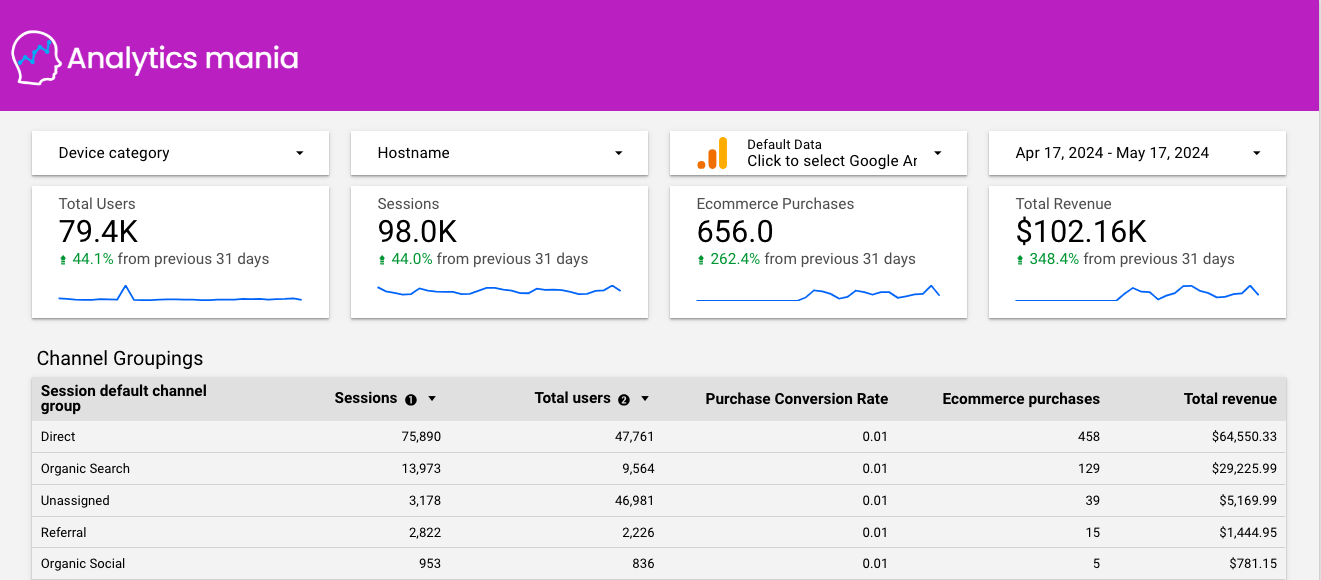
Databox’s biggest competitor isn’t another expensive SaaS tool; it’s the free and incredibly powerful Google Looker Studio. While this Databox review finds it faster to set up for basic needs, Looker Studio offers far more flexibility and zero subscription cost for anyone willing to invest more time in learning it. For a broader picture of the competitive landscape, see our deep-dive on the Databox top alternatives and competitors breakdown.
Databox Review: Comparison vs. Google Looker Studio (formerly Google Data Studio)
| Feature | Databox | Google Looker Studio | Winner |
|---|---|---|---|
| Ease of Setup | Winner. For template-based dashboards, you can get a dashboard live in minutes. | Steeper learning curve. Requires more manual setup and a better understanding of data sources. | Databox |
| Customization | Limited. You are constrained by the available datablox and formatting options. | Winner. Near-infinite flexibility, with powerful features like native data blending. | Looker Studio |
| Cost | Expensive. Professional plans start at ~$231/month and go up quickly. | Winner. It’s 100% free. This is its killer feature. | Looker Studio |
| Integrations | Winner. Over 75 native one-click integrations, especially for non-Google platforms (Facebook, HubSpot, etc.). | Primarily focused on the Google ecosystem (e.g., Google Analytics, Google Ads, BigQuery). Non-Google sources often require paid third-party connectors. | Databox |
Verdict:
- Choose Databox if: Your priority is speed-to-value, you have the budget, and you need to connect to a wide range of non-Google data sources quickly. It’s the ideal choice for agencies that need to produce standardized, attractive reports for many clients.
- Choose Looker Studio if: Your data lives primarily within the Google ecosystem, and your number one priority is avoiding another monthly subscription fee. It’s the better choice for businesses that want maximum power and have the in-house talent to manage a steeper learning curve. One user on the r/dataanalysis subreddit explained, “We switched from Databox to Looker Studio. Once we got over the learning curve, we could build anything we wanted without paying $300 a month for the privilege.”
Databox Review: Comparison vs. Klipfolio
Klipfolio is another direct paid competitor. Both platforms share the “easy for basics, complex for advanced” DNA.
If you’re evaluating Databox, it’s worth comparing it to direct alternatives like Klipfolio and Geckoboard, which also focus on simple, shareable KPI dashboards. In our analysis, Klipfolio’s pricing can be more predictable for some user types, but its user interface is often reported as being less intuitive than Databox’s PCMag Databox Review. You can also browse our latest coupons list of all coupons on website for current promotions across the entire BI tool category.
Final Verdict: Is Databox Worth It in 2026?
After this extensive Databox review, the final verdict is clear.
Databox is a tale of two products. For marketing agencies and internal teams who need fast, beautiful, template-driven reporting from a ton of different sources, it is often worth the high price. The speed-to-value is undeniable. However, for anyone on a tight budget or those who need to perform deep, custom analytics, it is not worth it.
Category & Positioning
- Product Type: Cloud-based KPI dashboarding & Business Intelligence platform
- Best For: Marketing agencies, SMB in-house marketing/sales teams, executive reporting
- Founded: 2011 — HQ in Slovenia & Boston, MA (USA), led by CEO Davorin Gabrovec
- Pricing Range: Free → $381/month (Performance plan); realistic TCO ~$7,137/year for a 20-person team
Key Features
- Dashboard Editor: Drag-and-drop interface for non-technical users
- 75+ Native Integrations: Google Analytics, HubSpot, Facebook Ads, Salesforce, Stripe, Zendesk and more
- 300+ Pre-Built Templates: Industry-specific starter dashboards
- Data Calculations: Visual query builder for custom metrics (steep learning curve)
- Goal Setting & Alerts: Numerical goals with Slack/email notifications
- Insights AI: Automated trend flagging (utility limited per user reviews)
- Sharing Options: Public links, scheduled PDF snapshots, TV screen mode
- White-Labeling: Paid add-on for agency client deliverables
Performance Metrics
- Setup Speed: Template-based dashboard in <10 minutes (best-in-class)
- Custom Metric Build Time: Hours to days depending on complexity
- Dashboard Load Time: 10-30 seconds for complex multi-source dashboards (performance degradation reported)
- Integration Stability: Generally reliable; occasional API disruptions (Facebook Ads Aug 2024, LinkedIn Ads Jul 2024)
Security & Compliance
- SOC 2 Type II: Certified
- GDPR: Fully compliant, DPA available, EU data centers
- HIPAA: BAA available on Professional plan and above
- Encryption: TLS 1.2+ in-transit, AES-256 at-rest
- ISO 27001: ❌ Not certified — verify with sales for enterprise procurement
Ideal Use Cases & Professional Applications
- Agency client reporting loop: Master template → clone per client → white-label → scheduled PDF snapshots (20hrs/month → 2hrs/month)
- SMB executive dashboards: Single “Company Health” URL combining marketing, sales, finance, support
- Sales team KPI scoreboards: TV-mode public leaderboards for calls, demos, revenue progress
- Goal tracking: Quarterly MQL targets, revenue pacing, automated Slack alerts on at-risk metrics
User Experience & Learning Curve
- Day 1-7 (Honeymoon): Smooth, template-driven, intuitive — easy 10-minute setup
- Day 8+ (The Cliff): Custom metrics via Data Calculations feature → steep, programmer-mindset required
- Documentation: Good for basics, sparse for complex custom use cases
- Paid onboarding: Available from $625 — optional for tech-savvy teams
✅ Strengths (What We Love)
- Speed to value: Functional, good-looking dashboard running in minutes
- Massive integration library: 75+ native one-click integrations — best-in-class for marketing & sales tools
- Excellent for agency client reporting: Templating + white-labeling + scheduled sharing = major efficiency gains
- Clean, attractive UI: Dashboards visually appealing, designed for non-technical stakeholders
- Strong security baseline: SOC 2 Type II, GDPR, HIPAA capability
- Free plan available: No credit card required — truly risk-free evaluation
- Goal Setting with alerts: Turns passive dashboards into active performance management
⚠️ Things to Consider
- Expensive and complex pricing: Tiers challenging for growing teams; TCO much higher than sticker price
- Steep learning curve for advanced features: “Data Calculations” is a significant hurdle for non-technical users
- Performance degradation: Dashboards can become slow as you add more data sources and complexity
- Not a true data exploration tool: Built for reporting known KPIs, not discovering new insights in raw data
- Insights AI is unproven: Limited utility per user feedback; treat as bonus, not core feature
- Vendor lock-in: Dashboards and custom metrics not easily portable
- No ISO 27001: May be a blocker for enterprise procurement
- API stability varies: Occasional integration disruptions following upstream API changes
Clear Recommendations for User Segments
Different teams have wildly different outcomes with Databox. Here’s where the value lands cleanly:
- We Recommend Databox If:
- You are a marketing agency that can build the high cost into your client retainers. The efficiency gains are likely worth it.
- You are an in-house team with a clear budget whose primary need is to automate the creation of executive dashboards from many different SaaS tools, and you value speed over flexibility.
- We Recommend an Alternative If:
- You are on a tight budget. Use the free Google Looker Studio instead.
- You need to perform deep, exploratory data analysis. Use a real analytics tool like Tableau or Power BI.
- Your data lives almost entirely in the Google ecosystem. Looker Studio is a more powerful and cost-effective choice for you.
This independent Databox review is based on our expert analysis. Begin a free trial with the specific goal of building your most complex dashboard to test performance limits and verify pricing and features on the official Databox website before making a purchase. For a fast cross-check against this analysis, you can also revisit our standalone Databox Review guide at any time.
Frequently Asked Questions
Q1: How much does Databox really cost in [year]?
A: While the advertised price for the popular Professional plan is around $231/month (when billed annually), a realistic total cost of ownership (TCO) is often much higher. In our analysis for this Databox review, a 20-person team could expect to pay over $7,000 annually Databox Official Pricing. This figure accounts for the base subscription, mandatory fees for additional users (at $29/user/month), optional paid onboarding (starting at $625), and the internal labor cost for setup and configuration, which can take 10-40 hours Databox Add-ons Pricing. For budget-conscious teams, it’s crucial to calculate this full TCO rather than relying on the sticker price alone — and to apply a money-saving deal for Databox if one is available before purchase.
Q2: Is Databox genuinely easy to use?
A: Yes, for its intended purpose, it’s genuinely easy. A key finding of our Databox review is its exceptional “speed-to-value.” Using their pre-built templates, you can connect a data source like Google Analytics and have a functional, attractive dashboard live in under 10 minutes. The user interface is clean and intuitive for basic operations. However, this ease of use ends the moment you need custom metrics. The “Data Calculations” feature has a steep learning curve and is a common point of frustration for users without a technical background, as noted in numerous reviews on Capterra.
Q3: Should I use Databox or Google Looker Studio?
A: The choice depends entirely on your priorities and budget. We recommend using Databox if you have a healthy budget and your primary goal is connecting many non-Google data sources (like HubSpot, Facebook Ads, or LinkedIn Ads) as quickly as possible. Its native integration library is a key advantage. Conversely, we recommend the free Google Looker Studio if your data lives mostly in the Google ecosystem (GA4, Google Ads, BigQuery) and your top priority is avoiding another monthly subscription fee. Looker Studio offers far greater customization but requires a steeper initial learning curve to master TrustRadius Databox Reviews.
Q4: What are the main problems with Databox?
A: Based on our comprehensive Databox review and analysis of user feedback, the three most common problems are: 1) Pricing Complexity: The model scales expensively and can feel punishing for growing teams, with a TCO that is often double the advertised price. 2) Steep Learning Curve for Customization: While basic dashboards are easy, the “Data Calculations” feature needed for custom metrics is unintuitive for non-analysts, undermining the “zero-code” promise G2 Databox Reviews. 3) Performance Degradation: Dashboards loaded with many data sources or complex calculations can experience slow load times, sometimes taking 10-30 seconds, which is a challenge when presenting live.
Q5: Is the Databox free plan worth it?
A: The free plan is not viable for any long-term business use due to its strict limitations (3 dashboards, 3 data sources, daily data refresh). However, it is one of the best “extended free trials” on the market. We recommend using it to aggressively test the platform’s core functionality before committing to a paid plan. You can connect your most important data sources, build your most complex dashboard to stress-test performance, and experiment with the “Data Calculations” feature. Since it doesn’t require a credit card for signup, it’s a completely risk-free way to evaluate the tool for your specific needs Databox Official Website.
Q6: Who is Databox best for?
A: Databox provides the most value to two specific groups. The first is marketing agencies, who can leverage the template library, white-labeling features, and automated report sending to dramatically increase their client reporting efficiency. The cost can be built into client retainers, making the high price justifiable. The second group is in-house marketing teams at SMBs who have a dedicated budget and need to automate executive-level reporting from a wide variety of SaaS tools. These users prioritize speed and convenience over the deep, exploratory analytics offered by more complex platforms Forbes Advisor Databox Review.
Q7: Why is Databox so expensive?
A: Databox’s pricing strategy reflects its target market and value proposition. It is expensive because it targets marketing agencies and established SMBs that can absorb the cost and are willing to pay a premium for convenience and speed. A significant portion of the cost is justified by the investment in developing and maintaining over 75 native, one-click integrations, which saves users countless hours of complex setup Databox Integrations. Essentially, you are paying for the platform to handle the difficult data connection and visualization work, allowing teams to create sophisticated reports in minutes instead of days. The high price filters for customers who value time-savings over direct cost — though savvy buyers will always check for a voucher code for Databox before committing.
Q8: Does Databox work with HubSpot?
A: Yes, and the Databox-HubSpot integration is one of its most popular and robust connections. It is consistently praised in user reviews as a top-tier integration that works exceptionally well. Many agencies and businesses use Databox specifically to build more advanced and visually appealing reports from their HubSpot data than what is available through HubSpot’s native reporting tools G2 HubSpot+Databox Reviews. You can pull in data from the Marketing, Sales, and Service Hubs to create comprehensive dashboards that track the entire customer lifecycle, from first website visit to closed deal and beyond.